Weekly Work Plans and Percent Plan Complete: Measuring Whether the Plan Holds

Weekly Work Plans and Percent Plan Complete: Measuring Whether the Plan Holds

ConstructionReadinessPercent-complete trackingProgress dashboards
Eric Dawson
Eric Dawson
4 min
Last update: 13 Aug 2026

What a weekly work plan is, and what it is not

A weekly work plan is the list of tasks each trade commits to completing in the coming week. It is the point where a schedule stops being a forecast and becomes a set of promises made by named people.

The distinction that makes it work is between scheduled work and committed work. An activity appearing in next week's programme means the plan expects it. A commitment means a foreman has looked at the crew, the materials, the access and the predecessor work, and said yes.

Most weekly meetings blur the two. The schedule is read aloud, nobody objects, and silence is recorded as agreement. That is how a plan can be 100 percent agreed on Friday and 60 percent delivered by the following Friday.

A commitment worth recording has four things attached: a named person, a defined piece of work, a definition of what done means, and the confirmation that the conditions to start it are in place. Anything looser is an expectation.

How to calculate Percent Plan Complete properly

Percent Plan Complete is the standard measure of planning reliability. The Lean Construction Institute defines it as completed tasks divided by total planned tasks. Count only tasks finished as promised, on the day promised.

The scoring rules decide whether the number means anything, and this is where most teams quietly cheat themselves:

  • Partial completion scores zero. Ninety percent of a task is not a kept promise, because the successor still cannot start.
  • Work completed early but not promised does not count. Percent Plan Complete measures the plan, not the output.
  • Tasks added midweek do not enter the denominator. If they did, teams could raise the score by planning less.
  • Every miss gets a recorded reason. Without reasons the metric describes a problem without locating it.

Teams commonly target 80 percent or above, but a stable 65 percent with well understood causes is more useful than an unexplained 90 percent. The trend and the reasons carry the information. The number on its own mostly tells you how honestly the team is scoring.

Reasons for variance are where the value sits

The reason code is the part that changes projects. Percent Plan Complete tells you the plan failed. The variance reason tells you where to intervene, and after a few weeks the same three or four causes will account for most of the misses.

A workable starter set of reasons: prerequisite work incomplete, materials not on site, equipment unavailable, labour shortage or reassignment, information or approval outstanding, access or area not available, weather, design change, rework, and change in priority.

Two patterns are worth watching. If information and approvals dominate, the problem is upstream of the field and no amount of pressure on the trades will fix it. If prerequisite work dominates, the lookahead is not clearing constraints far enough ahead, and the fix belongs in make ready planning rather than in the weekly meeting.

One caution about culture. This only works if people can record an honest reason without being blamed for it. The moment a variance reason becomes evidence in a commercial argument, the codes drift toward whichever cause is least contentious, and the data stops being worth collecting.

Reading the numbers together

Two indicators sit alongside Percent Plan Complete and explain it. Tasks Made Ready shows how many upcoming activities were prepared as planned, which tells you whether constraint clearing is working. Tasks Anticipated shows how many activities in the weekly plan had been identified in the lookahead beforehand.

Read together they diagnose the planning system. High Percent Plan Complete with low Tasks Anticipated means the team is completing work it never planned, which is improvisation that happened to succeed. Low Percent Plan Complete with high Tasks Made Ready usually points at execution or resourcing rather than planning. Both figures low means the lookahead is not functioning and the weekly meeting is absorbing work it cannot fix.

Collecting all three by hand is what usually kills the practice. Someone has to chase commitments, record outcomes, categorise reasons and rebuild the board every week, and that job disappears the moment the project gets busy.

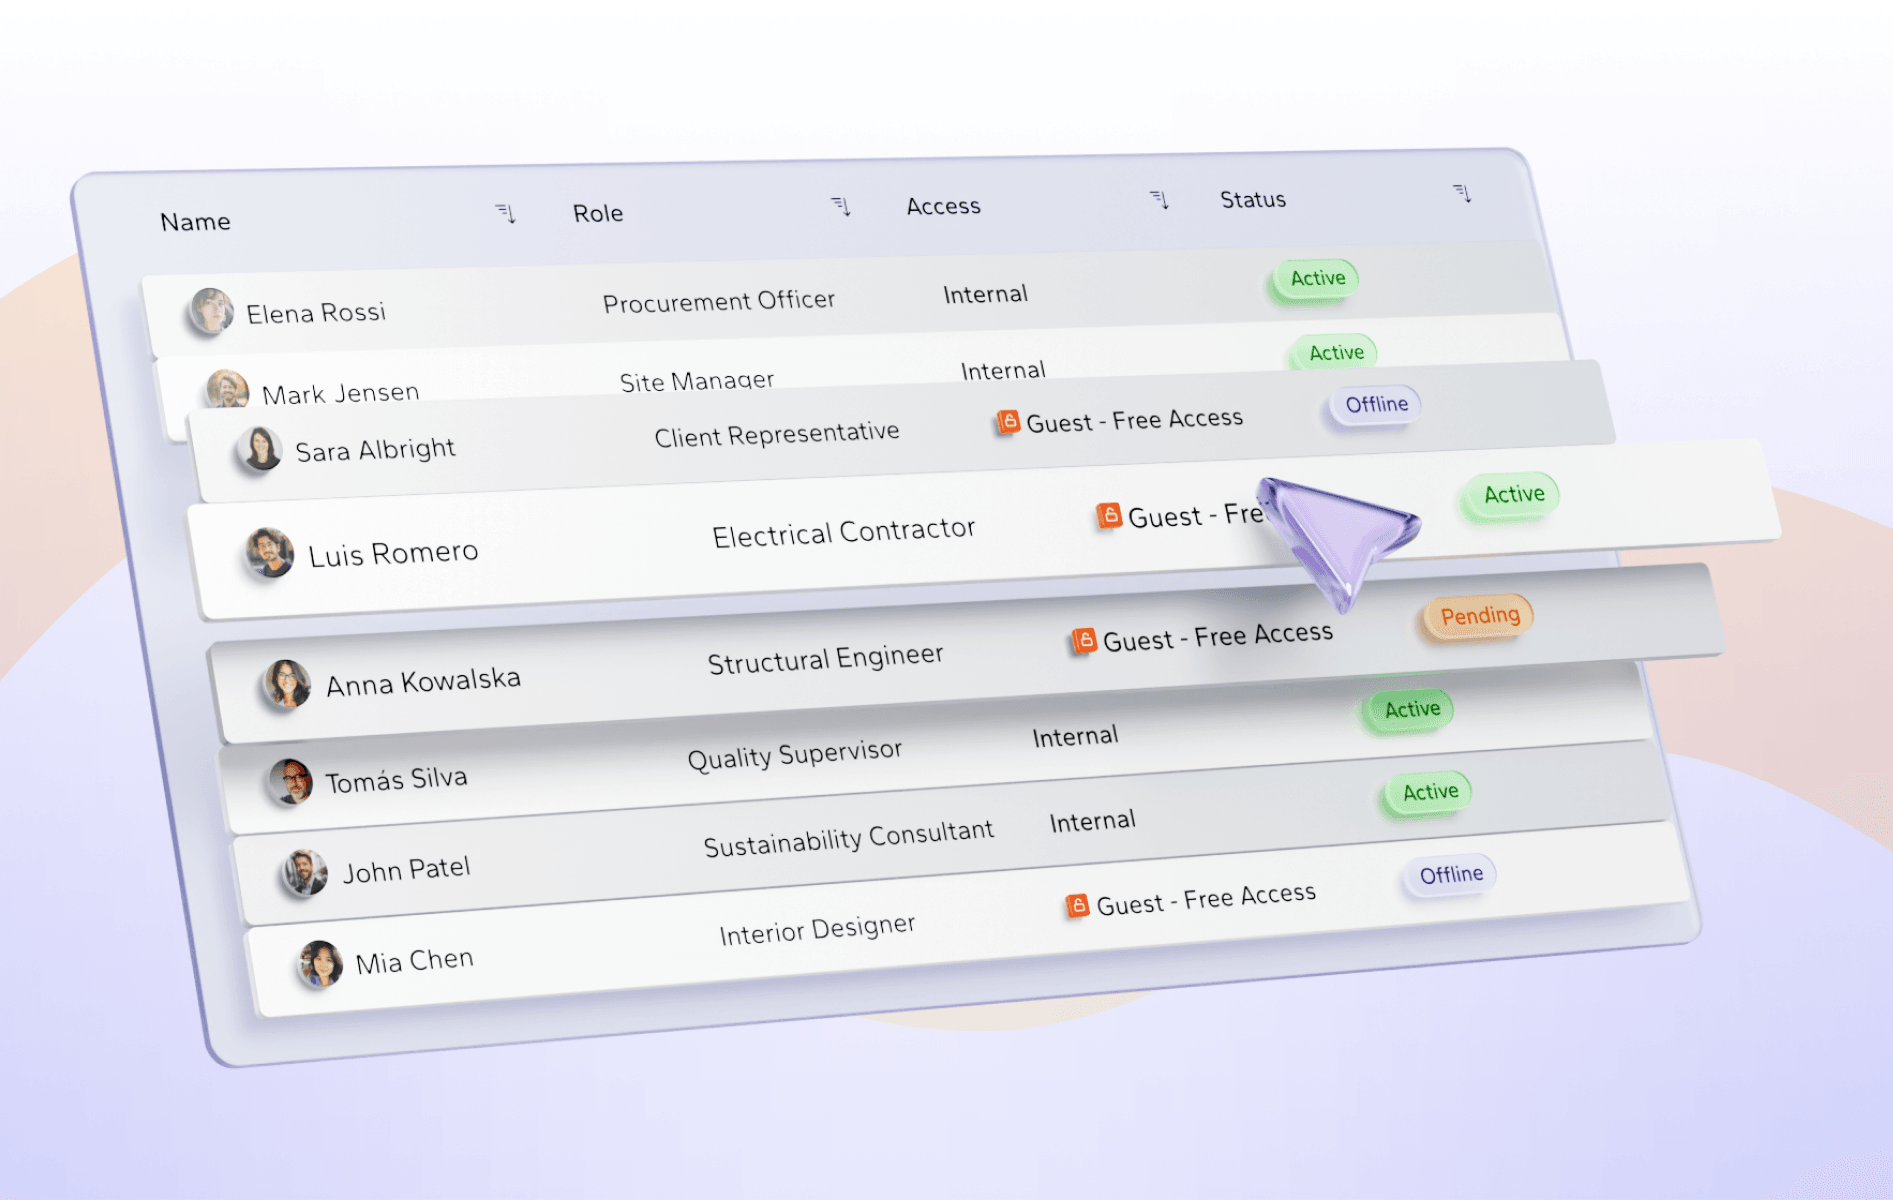
In Playbook the commitment is captured where it is made. Trade leads confirm or decline work from site, progress and blockers are reported against the task itself, and the record of what was promised, what happened and why is kept without anyone rebuilding a spreadsheet on Friday afternoon.

How do you calculate Percent Plan Complete?

Divide the number of tasks completed exactly as promised by the total number of tasks promised for that week. Partial completions score zero, and work done that was not promised is excluded from both figures.

What is a good Percent Plan Complete score?

Many teams aim for 80 percent or higher, but the figure only means something alongside the reasons for variance. A consistent 65 percent with understood causes gives you more to act on than an unexplained 90 percent.

What is the difference between a weekly work plan and a lookahead?

The lookahead covers the next few weeks and exists to clear constraints so work becomes possible. The weekly work plan covers the coming week only and records what people have committed to doing. The lookahead makes work ready, the weekly plan makes it promised.

Who should make the commitments in a weekly work plan?

The trade foremen and lead hands who control the crews, supported by the superintendent and project engineer. Commitments made by people who do not control the labour are forecasts, not promises.

Share this post:

Note to editors:

High-resolution images and interviews with PYBK leadership team members are available upon request.

You might also like